Dynamic Data Visualization

In my internship at MAPEGY, I was allowed to work both front-end and back-end.
Most part of my work was rapid prototyping for data driven web applications, developing prototypes of dynamic visualizations, refactoring of
stored procedures as well as unit testing of stored procedures.
Later on, I could create an implementation of a dashboard to monitor system indicators and develop a possible concept of gamification for MAPEGY.SCOUT (a web
based data analysis tool for research and development).
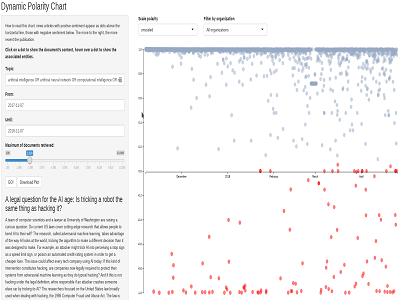
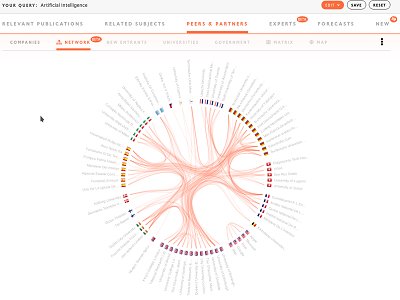
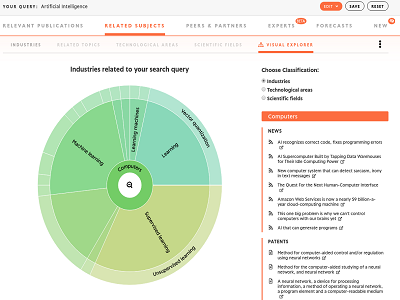
The included pictures on this page show just a few of my prototypes which part of them made it into the product.
Characteristics
| Role: | Developer |
| Internship period: | 6 Months |
| Plattform: | PC |
| Used Languages: | PostgreSQL |
| JavaScript | |
| R | |
| Link: | MAPEGY |

